Sometimes you need to have an idea about what happens on your JVM. In fact, your need to profile and monitor your Java Virtual Machine to see how your resources are used. Three ways will be shown it this article to know how you can Profile and Monitor your Java Virtual Machine (JVM).
Table of contents
1- JConsole
Java offers a graphical user interface called JConsole that complies to the Java Management Extensions (JMX) specification. It gives you a good overview of what happens in your JVM (Memory, threads…). Let’s see how you can use it !
- Necessary if your are on a JDK 5
If you are using a JDK5, you need to add the property -Dcom.sun.management.jmxremote to your application to be able to use JConsole.
If you are running your server on windows, locate your server start script, for example run.bat under <YOUR_SEVRER>/bin and add this line :
|
1 |
set JAVA_OPTS=%JAVA_OPTS% -Dcom.sun.management.jmxremote |
On linux server, locate your server start script, for example run.sh and add the following line :
|
1 |
JAVA_OPTS="$JAVA_OPTS -Dcom.sun.management.jmxremote" |
To run Jconsole, follow these instructions :
- Open a prompt command a tape « jconsole » or go to JDK_HOME/bin and execute jconsole.exe
- Select your application and click “Connect”
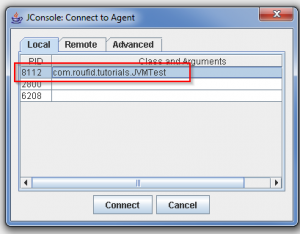
JConsole : Connecting to agent
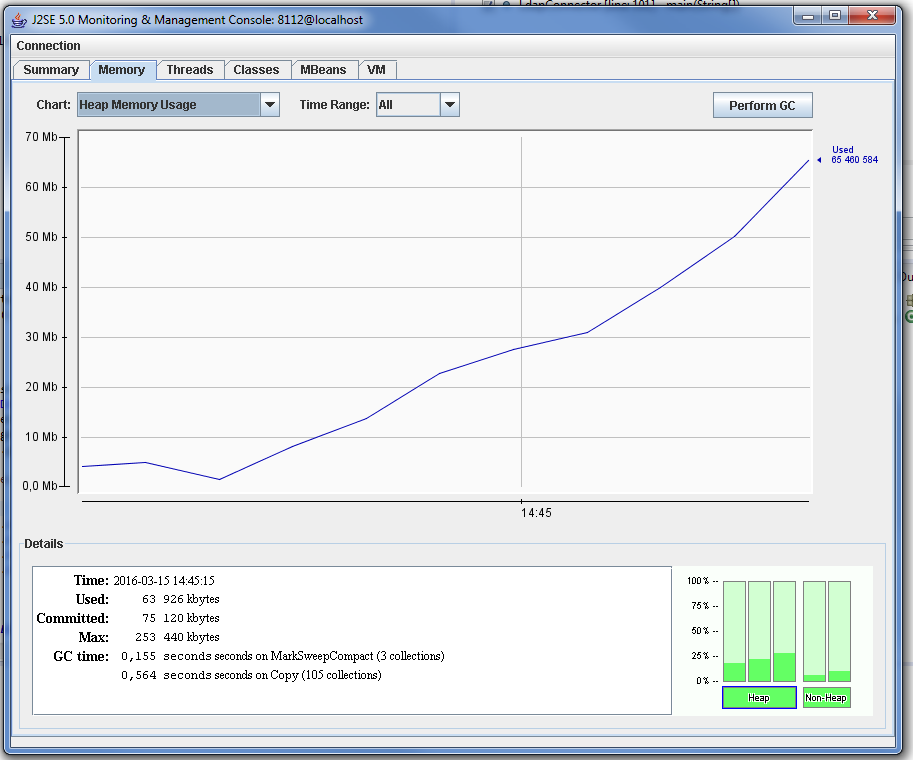
- JConsole will open and your can monitor your JVM
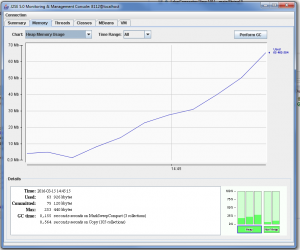
Jconsole JVM monitoring

If your want to profile a remote Java Application, go the “Remote” tab, set the information of the remote server and click connect.
2- Java VisualVM
Since JDK6
Since JDK6, Java introduced « JVisualVM ». JVisualVM play the same role as jconsole but it’s much more improved with better user-friendly interface.
To run JVisualVM , follow these instructions :
- Open a prompt command a tape « jvisualvm » or go to your JDK_HOME/bin and execute jvisualvm.exe
- Java VisualVM will open. On “Applications” view, double-click on the application you want to monitor. A new tab will open where you will be able to see what happens in your jvm.
JVisualVM Monitoring

If your want to profile a remote Java Application, on “Applications” view, right-click on “Remote“, and click on “Add remote host…”, set the information of the remote server and click “Ok“.
3- Monitor JVM on Eclipse IDE
If you are using Eclipse IDE and want to monitor your JVM, you can use the free jvmmonitor plugin.
-
Plugin installation
The plugin must be installed on your Eclipse IDE. Choose one of the following options :
- On Eclipse, click Help -> Eclipse Marketplace… and tape “JVM Monitor” and click Install button
- OR : Help -> Install New Software… > Add…, and enter the following update site.
1http://www.jvmmonitor.org/updates/3.8 - OR : You can also manually install the plugin by download this zip file, and unzip it in $ECLIPSE_HOME/dropins folder
-
Use JVM Monitor
On Eclipse, click on Window -> Open perspective -> Other and Select Java Monitor and click OK.
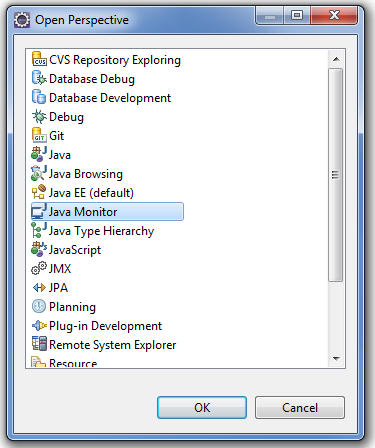
Opening Java monitor Perspective
Start your application and on the JVM Explorer view, select the Name/PID corresponding to your application, right click and choose “Start monitoring”
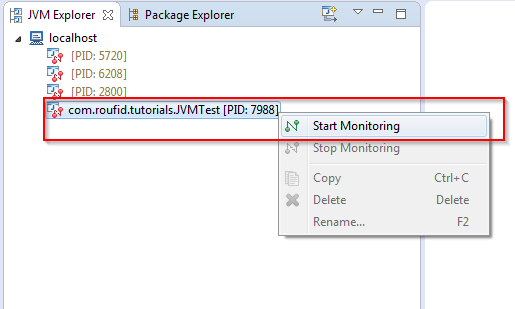
JVisualVM – Start application monitoring
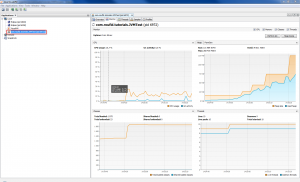
On the properties view, you can use the different taps to monitor your JVM.
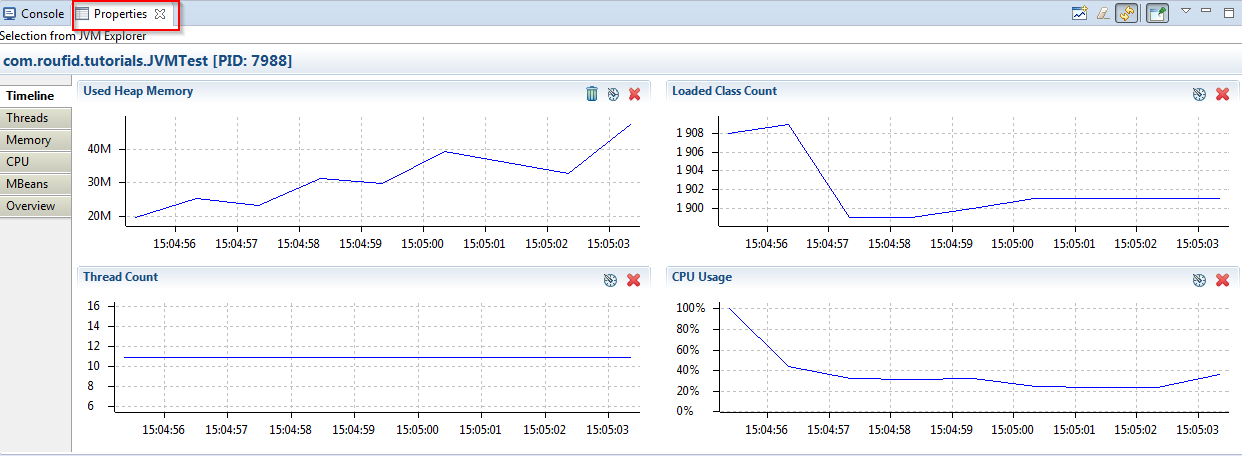
Java monitor plugin